Overview
High-level overview of Antimicrobiogram feature
Overview
Antimicrobiogram is an organization-scoped heatmap that summarizes organism vs antibiotic sensitivity from microbiology and molecular report payloads. It trades live-join complexity for predictable, fast reads by storing denormalized summary rows and computing grouped sensitivity at read time.
Why it exists
- Fast, repeatable reporting for stewardship and operations.
- Exportable, lab-scoped view that’s easy to interpret and share.
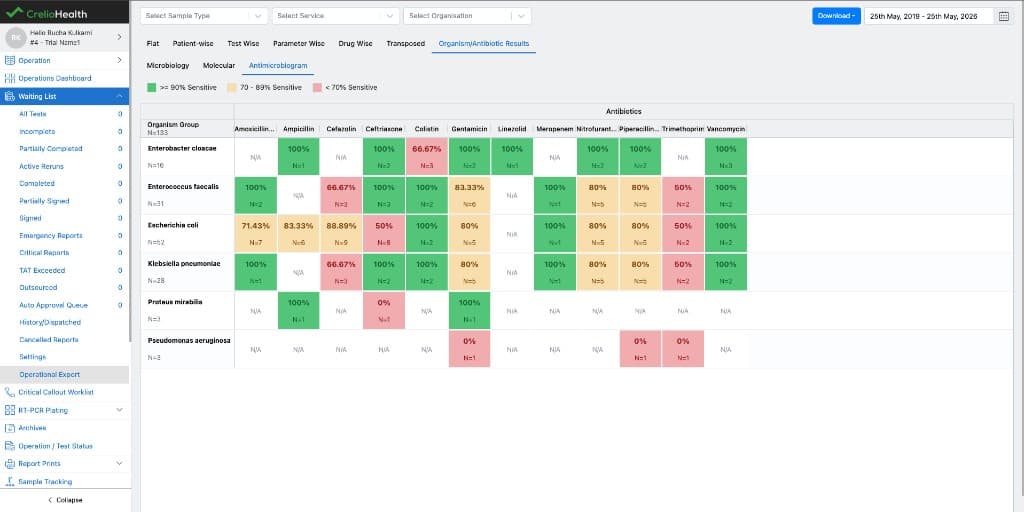
What users see
- Operations → Operational Export → Organism/Antibiotic Results (sub-tabs: Microbiology, Molecular, Antimicrobiogram).
- Matrix: rows = organism, columns = antibiotic, cell = sensitivity% (with N).
Why this feature matters
Antimicrobiogram is useful for both operational and clinical reasons. Operationally, it gives the lab a reusable analytics view on top of already approved and bill-linked report data. That means the lab can study historical trends without reprocessing raw report payloads in the browser every time. Clinically, it helps teams understand local antibiotic sensitivity trends. That is useful for stewardship discussions, internal review, retrospective analysis, and exported sharing with stakeholders who need a quick organism-antibiotic picture.
What the user sees
The feature appears inside the Operational Export module in Operations under Organism/Antibiotic Results
Inside that main tab, the UI exposes three sub-tabs:
MicrobiologyMolecularAntimicrobiogram
The first two sub-tabs help the user inspect detailed rows for raw results for Microbiology and Molecular test results. The third sub-tab is the true matrix-style report that the business refers to as Antimicrobiogram.
Core product rules
| Rule | Meaning |
|---|---|
| Antimicrobiogram is always organization-wise | The visible matrix is built for a single organization at a time |
| Default selection is the first organization with available data | When the page opens, the frontend automatically selects the first organization derived from the fetched result set |
| Rows are organisms | Each matrix row represents one detected organism |
| Columns are antibiotics | Each matrix column represents one antibiotic |
| Cell value is sensitivity percentage | The visible percentage is Sensitive / Total Tested |
| Export is first-class | Users can download the matrix as Excel directly from the page |
Sensitivity calculation
The most important business rule in this feature is the sensitivity percentage calculation. For each organism + antibiotic combination:
Sensitivity % = (Sensitive count / Total tested count) * 100Example:
- organism =
E. coli - antibiotic =
Ampicillin - tested count =
415 - sensitive =
191 - resistant =
200 - intermediate =
24
So:
Sensitivity % = 191 / 415 * 100 = 46.02%That sensitivity percentage is what is displayed in the cell. The same grouped data also keeps the resistant and intermediate counts and percentages, which are useful for the tooltip/export layer and for future extension.
Feature surfaces
| Surface | Responsibility |
|---|---|
| Support Dashboard | Turns the feature on or off at lab level |
| Login/session payload | Exposes is_antimicrobiogram_enabled to the frontend |
| Operational Export page | Shows the Organism/Antibiotic Results tab when enabled |
| OrganismAntibioticResultsView | Fetches, filters, renders, and exports the data |
| Summary and queue tables | Store the processed rows and rebuild work |
Core storage model
Antimicrobiogram is backed by three main operational tables plus the lab feature flag.
| Layer | Table | Why it exists |
|---|---|---|
| Feature switch | labFeatures.is_antimicrobiogram_enabled | Controls availability and backfill onboarding |
| Summary store | OrganismAntibioticSummary | Holds denormalized organism-antibiotic result rows used for reads |
| Repair queue | OrganismAntibioticSummaryRepairQueue | Holds one-day historical windows that must be rebuilt |
| Migration tracker | crelio_data_migrations with migration_type='ANTIMICROBIOGRAM' | Tracks large backfill jobs such as first-time enablement |
The three job types
The feature stays fresh using three complementary job types.
1. Daily job
This is the normal day-to-day loader.
It runs once per day and processes the previous local day for each enabled lab.
Example:
- job execution time =
2026-04-09 02:00local lab time - processed range =
2026-04-08 00:00:00to2026-04-08 23:59:59local day
2. Repair job
This job exists for historical correction.
If something important changes on a past bill or report, the feature does not wait for a full migration. Instead, it queues a one-day repair for the affected day and rebuilds just that slice.
3. Migration job
This is the historical backfill path.
When a lab enables Antimicrobiogram, the system schedules a long-window backfill so the report is useful from day one instead of showing only newly arriving data.
End-to-end data flow
At a high level, the flow looks like this:
Why the architecture works well
This feature works well because it separates concerns cleanly:
- source systems continue to save report values normally
- backend jobs turn those values into a reporting shape
- reads are fast because they hit the summary table instead of the full transactional graph
- repairs are precise because they are day-window driven
- the frontend can stay simple and focus on filtering, matrix layout, and export
Short mental model for engineers
If you want the simplest possible mental model, think of Antimicrobiogram like this:
- report values are the raw truth
OrganismAntibioticSummaryis the reporting truth- daily jobs keep yesterday ready
- repair triggers keep historical days correct
- migration jobs make newly enabled labs useful immediately
- the frontend turns grouped summary rows into an organization-wise heatmap
That is the full feature in one chain.